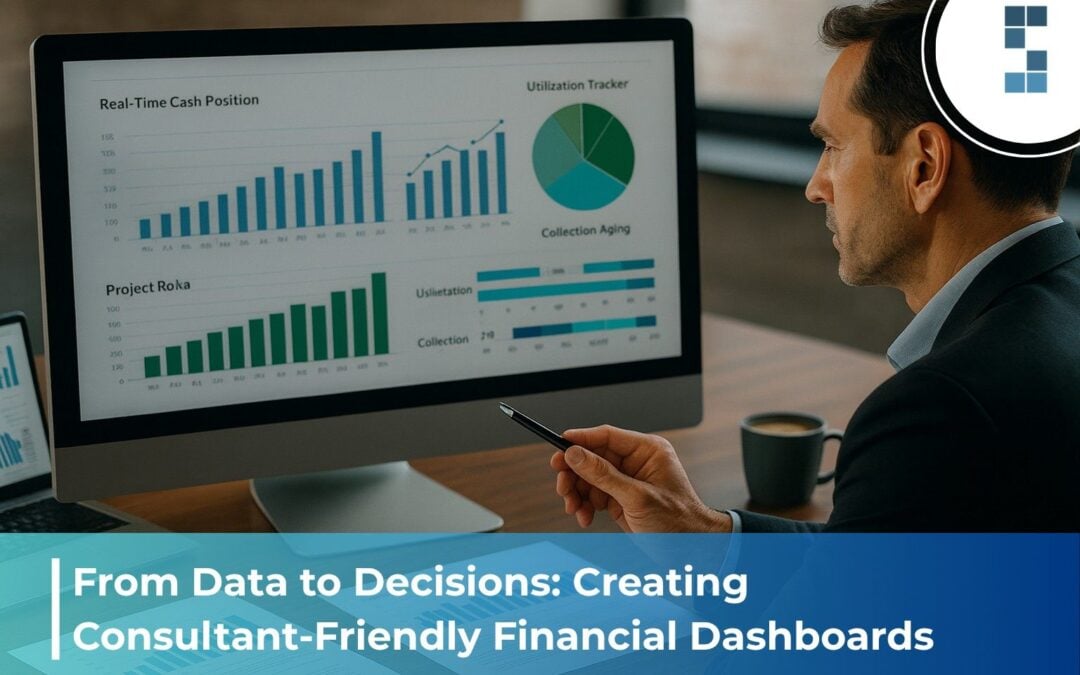
From Data to Decisions: Creating Consultant-Friendly Financial Dashboards
It’s 3:17 AM, and you’re lying there staring at the ceiling again. Your mind’s racing through the same questions that hijacked your sleep last Tuesday. And the Tuesday before that. Which projects are actually making money? Will cash flow cover next month’s payroll? Should you take on that new client or hire another consultant first?
The irony isn’t lost on you. During daylight hours, you’re the strategic advisor. The one with all the answers. But when it comes to your own firm’s finances, you’re navigating in the dark with a dying flashlight.
Here’s the thing: You’re sitting on a goldmine of financial data. Every timesheet, every invoice, every expense report contains a piece of the puzzle. But without the right dashboard, it’s like having a Ferrari engine attached to bicycle wheels. All that power, going nowhere fast.
What if, instead of those 3 AM wake-ups, you could check your phone over morning coffee and know—really know—exactly where your business stands? Not through some complex spreadsheet gymnastics, but through clear, visual insights that take 30 seconds to understand?
That’s what a properly designed financial dashboard delivers. And it’s not as complicated as you think.
The Dashboard Dilemma: Why Most Consultants Are Flying Blind
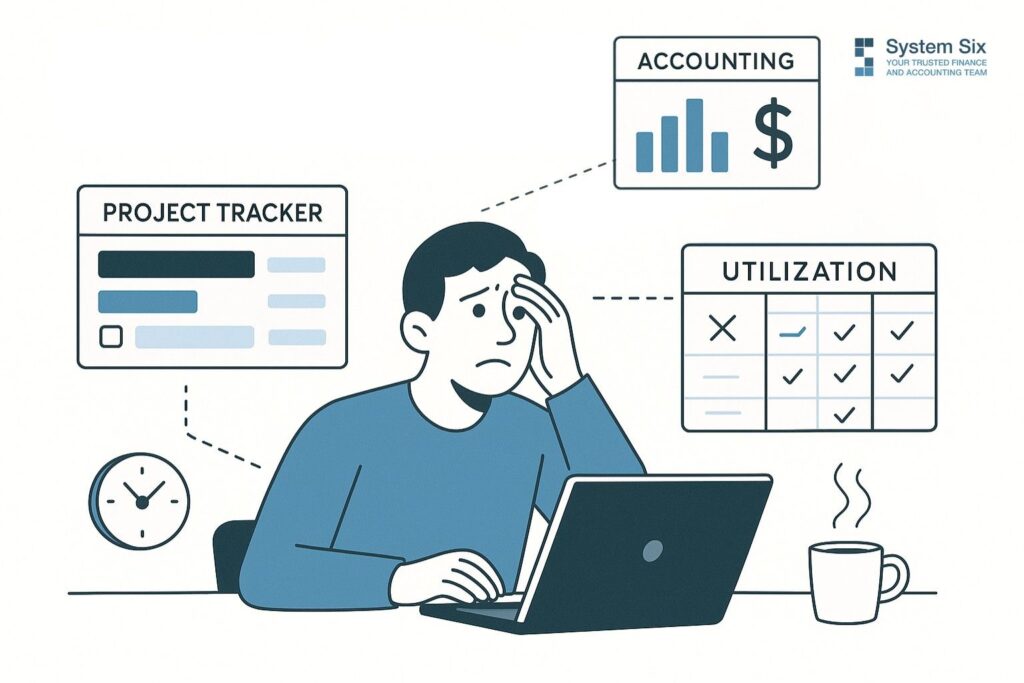
Let me paint you a familiar picture. Monday morning arrives, and you need to decide on that new project proposal. You pull up three different spreadsheets. The project tracker says one thing. The accounting export says another. And that utilization report from two weeks ago? It might as well be written in ancient Sumerian.
You spend the next hour trying to reconcile the numbers, jumping between tabs like you’re conducting some bizarre digital orchestra. By the time you piece together something resembling clarity, your first client call is starting. The decision gets punted to next week.
Sound familiar?
“Before implementing structured financial reporting, we were essentially guessing about which projects and clients were profitable,” admits Chris, founder of a healthcare consulting practice. “We’d celebrate landing big clients without understanding if they contributed to our bottom line.”
This isn’t just frustrating—it’s expensive. Every delayed decision is a missed opportunity. Every reactive scramble costs more than proactive planning. And the stress? That’s the hidden tax you pay every single day.
But what if you could see your entire financial picture in 30 seconds? What if those scattered spreadsheets transformed into a single source of truth?
The Essential Dashboard Elements: Your Financial Control Centre
Think of your dashboard like an aeroplane cockpit. You wouldn’t fly through clouds without instruments, yet that’s exactly how most consultants run their businesses—on gut feel and good intentions.
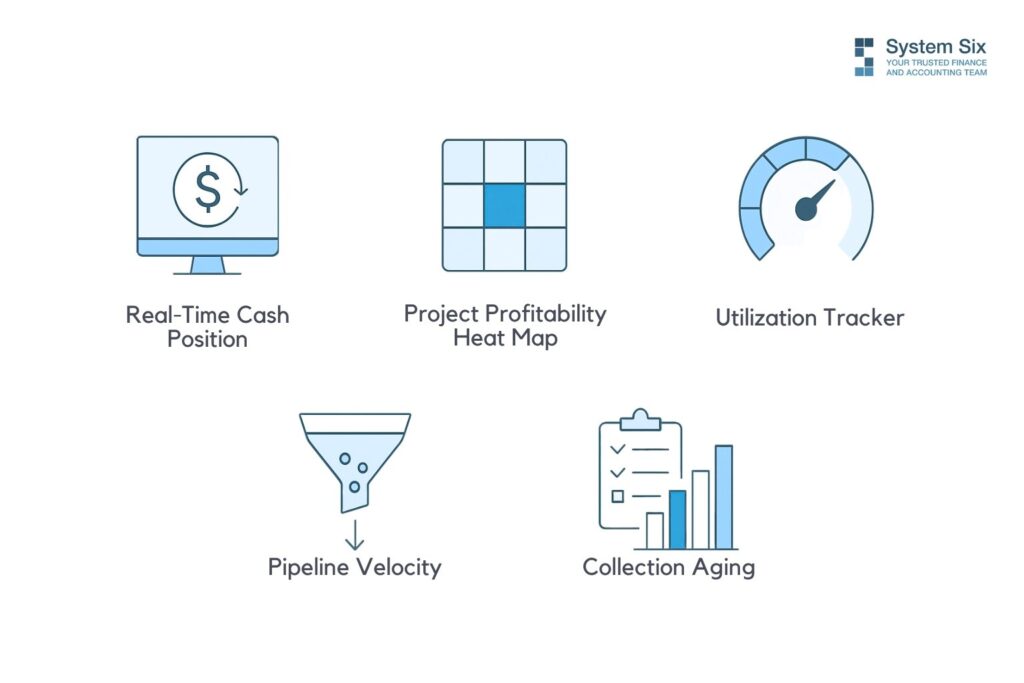
Your financial dashboard needs five essential instruments to keep you flying straight:
Real-Time Cash Position
This isn’t your bank balance. It’s your true available cash after accounting for upcoming payables, pending receivables, and that payroll hitting next week. One consultant told me this single metric helped them sleep through the night for the first time in months. Know if you can make that hire today, not after three hours of spreadsheet archaeology.
Project Profitability Heat Map
Picture this: Every active project displayed as a colored tile—deep green for your profit champions, yellow for break-evens, red for the silent killers. “We discovered our mid-sized projects were more profitable than our largest engagements,” one System Six client notes. “The large projects carried hidden costs in coordination time and scope management that weren’t properly billed.”
Utilization Tracker
Your team’s time is your inventory, but unlike widgets in a warehouse, you can’t see it stacking up. This metric shows you exactly where capacity sits—who’s overwhelmed, who’s underutilized, and whether you need to hire or hustle for more projects. Track billable hours against available hours, and suddenly, those resource allocation decisions become crystal clear.
Pipeline Velocity
From the payment proposal, see how fast opportunities move through your funnel. This isn’t just about sales—it’s about cash flow prediction. When you know your average collection period is 47 days, not the 30 you assumed, you can plan accordingly.
Collection Aging
Those outstanding invoices aren’t just numbers; they’re your business’s oxygen supply. Visual aging buckets show you at a glance what needs attention today versus what’s flowing normally.
Here’s what matters: utilization rate (billable hours divided by available hours), realization rate (what you bill versus what you could bill at standard rates), and that critical collection period. Get these three right, and everything else falls into place.
Building Your Dashboard: From Chaos to Clarity
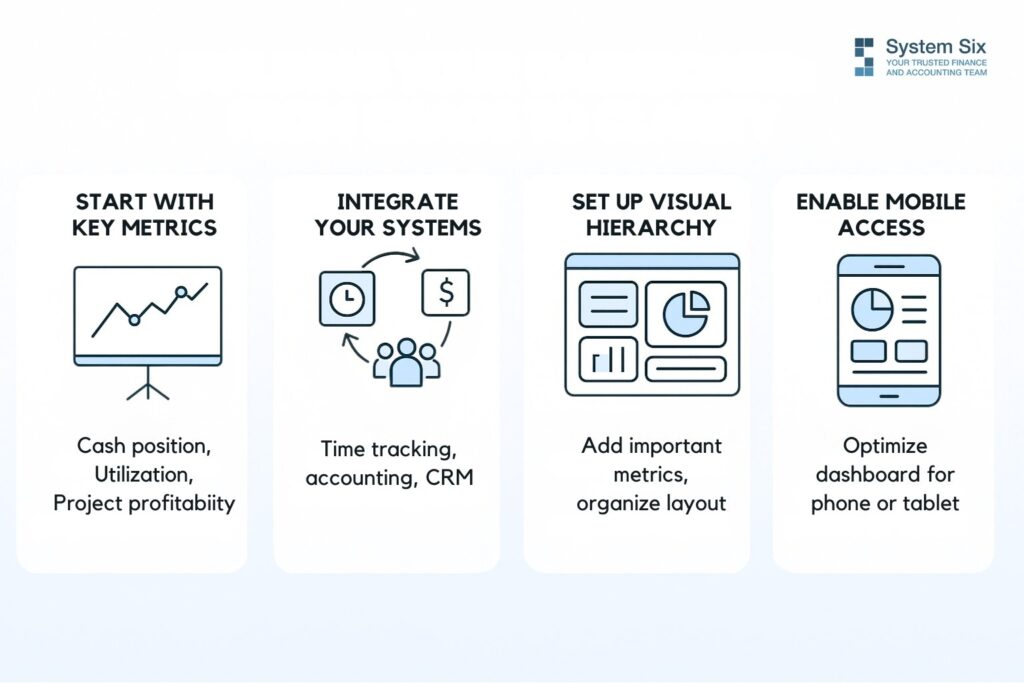
You don’t need to boil the ocean here. Start simple. Pick three metrics that keep you awake at night. For most consultants, that’s cash position, utilization, and project profitability.
Integration is everything. Your time tracking needs to talk to your accounting system. Your CRM should shake hands with your project management tool. Sounds complex? It’s not. Modern tools connect like Lego blocks—you just need to know which pieces fit together.
“Our financial reporting used to take 3-4 days each month,” shares a consulting firm owner who partnered with System Six. “Now it’s largely automated, providing real-time insights through dashboards we can check anytime.”
Think about that. Three to four days. Every month. That’s basically a full work week every quarter spent just figuring out where you stand. What could you do with that time back?
The visual hierarchy matters more than you’d think. Your most critical metrics—usually cash and utilization—should hit you immediately when you open the dashboard. Secondary metrics can live one click away. And those detailed reports you check quarterly? They can stay in the basement.
Don’t forget mobile accessibility. You’re checking this between client meetings, in the airport lounge, maybe even during that boring conference call (we won’t tell). If it doesn’t work on your phone, it doesn’t work.
The Transformation: Real Results from Real Firms
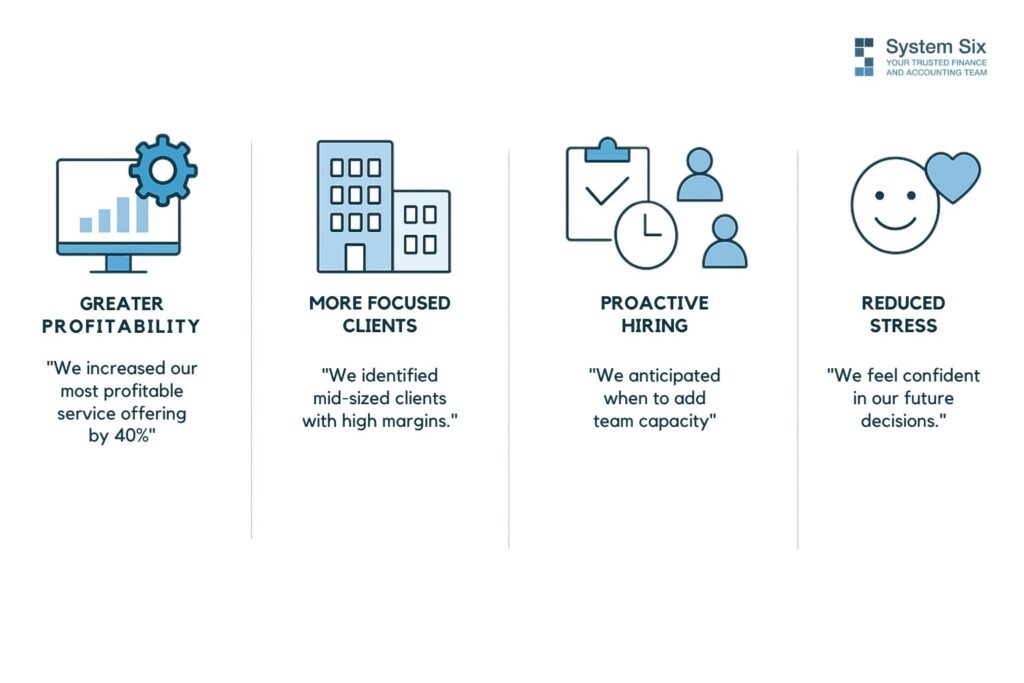
Let’s talk about Jamie, an IT consultant who thought technology implementation was her bread and butter. Her dashboard revealed something shocking: “We realized our technology implementation services were far more profitable than our strategic assessments. We reorganized our marketing to emphasize implementation, growing that service line by 40% within six months.”
Forty percent growth. Not from working harder, but from working smarter.
Or consider this healthcare consulting practice that discovered its sweet spot wasn’t where it expected. Those prestigious enterprise clients? Barely profitable after factoring in partner time and scope creep. But their mid-sized clients? Gold mines of efficiency and profit.
One System Six client transformed their entire hiring strategy: “Instead of reactive hiring when we’re already drowning in work, we now can see three months ahead when we’ll need additional capacity in specific practice areas.”
Imagine that—hiring before you’re desperate. Revolutionary concept, right?
But here’s my favorite testimonial, because it gets to what really matters: “Good financial reporting didn’t just improve our profitability—it reduced our stress. Instead of lying awake wondering if we’re making the right decisions, we now know where we stand and where we’re headed.”
That’s not just about numbers. That’s about life.
Your Next 30 Days
Here’s your challenge: Track how much time you spend this week gathering financial information versus actually analyzing it. I’m betting it’s a 90/10 split. Gathering, reconciling, checking, cross-referencing—all that busy work that feels productive but isn’t.
What if you flipped that ratio?
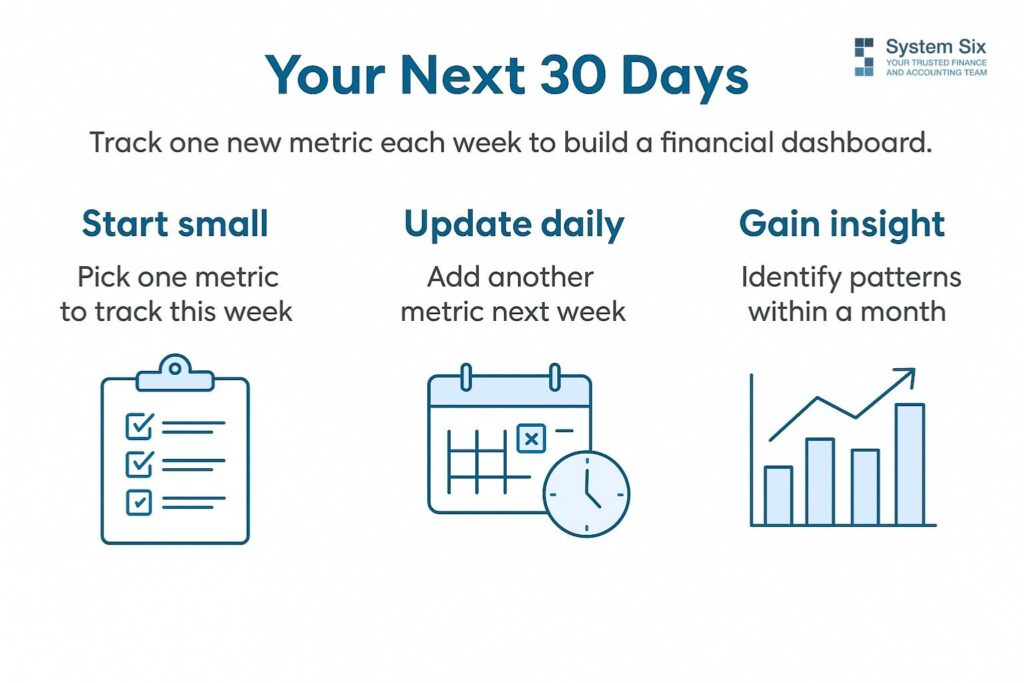
Start small. This week, pick one metric. Just one. Maybe it’s utilization. Set up a simple tracker—even a spreadsheet works to start. Update it daily. By Friday, you’ll see patterns you’ve been missing for years.
Next week, add cash position. The week after, project profitability. Within a month, you’ll have the foundation of a dashboard that actually serves you instead of the other way around.
The compound effect of daily visibility is remarkable. You start catching issues while they’re still pebbles, not boulders. You spot opportunities while they’re still available, not after they’ve passed. And those 3 AM anxiety sessions? They become 3 AM deep sleeps.
Every minute you spend staring at spreadsheets, trying to decode your business’s financial story, is a minute not spent serving clients or growing your firm. What could you accomplish with that time back?
Your data is trying to tell you something. Maybe it’s time you gave it a voice.
Ready to transform your financial chaos into clarity? The dashboard you need isn’t as far away as you think. Sometimes the first step is just admitting that what you’re doing now isn’t working. And that’s okay. Every successful consultant has been exactly where you are. The difference? They decided to do something about it.
About System Six
System Six is a Seattle-based bookkeeping and financial services firm that helps small and mid-sized businesses streamline their financial operations. We specialize in providing technology-driven financial management solutions for consulting firms, allowing owners to focus on growing their businesses without worrying about cash flow, payroll, or compliance issues. Our team of over 35 professionals brings an average of 10+ years of accounting experience to every client relationship, serving more than 175 businesses across the U.S. From accurate bookkeeping to cash flow forecasting, we deliver the financial clarity and peace of mind that consulting firm owners need to thrive. Learn more at www.systemsix.com.