Sarah checks her phone at 2 am. Again. The email notification glows in the darkness—payroll processing tomorrow, and she’s lying there doing mental math. Three big projects wrapping up this month, invoices going out next week, and payments probably 30 days after that. Maybe 45. Will the timing work? She’s got twelve consultants counting on her, and honestly, she’s not sure.
Here’s the thing: Sarah’s firm is busy. Really busy. Her team’s booked solid through next quarter. But busy doesn’t mean healthy, and revenue doesn’t always mean cash. Most consulting firms track the big numbers—total revenue, total expenses, what’s in the bank right now. But those numbers are like checking your destination on a map without looking at the route. You know where you want to end up, but you’ve got no idea if you’re about to drive off a cliff.
What consulting firms actually need are the metrics that work like vital signs—the ones that tell you what’s happening right now and what’s about to happen next. Think of monthly metrics as your firm’s pulse, blood pressure, and temperature all rolled into one dashboard. They don’t just show you where you’ve been. They show you where you’re headed in time to do something about it.
Why Monthly Matters (More Than You Think)
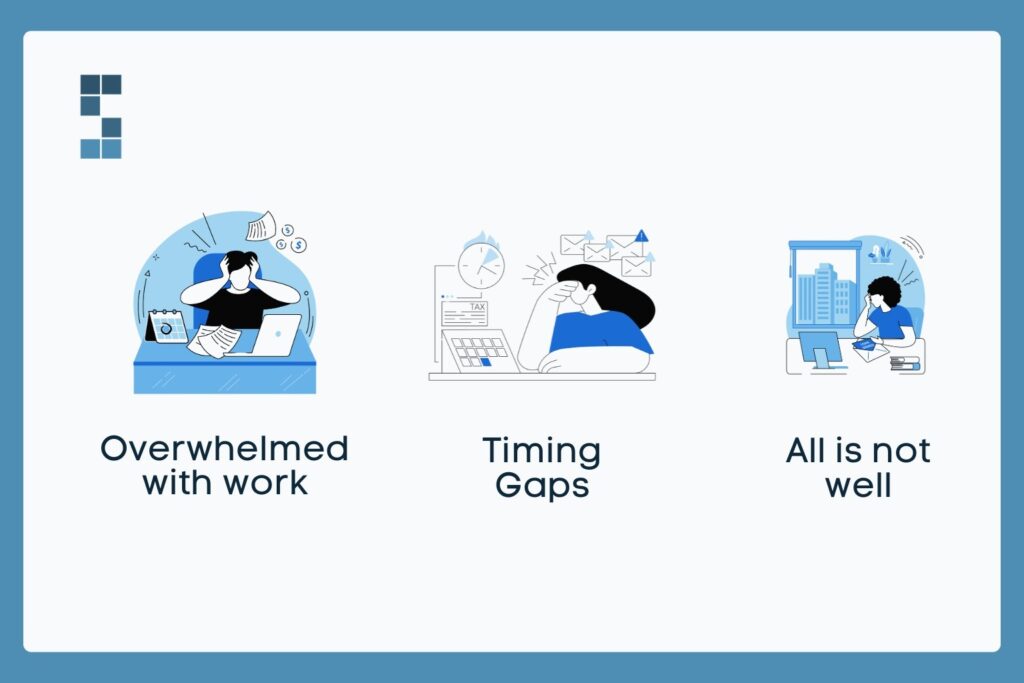
There’s a paradox at the heart of consulting businesses. You can feel swamped with work and still be heading toward a cash crisis. You can have a full pipeline and terrible margins. You can be growing revenue while profitability circles the drain.
The culprit? Timing gaps. What happens this month doesn’t show up in your bank account for 30, 60, or sometimes 90 days. That project you’re grinding on right now? The one keeping your team busy nights and weekends? You won’t see that money for at least a month after you finish the invoice and wait for payment. By the time you realize a problem exists, you’re already deep in it.
One System Six client discovered their utilization rate was actually 60%—despite everyone feeling overwhelmed. Turns out, their team was spending enormous chunks of time on internal meetings, administrative tasks, and “staying busy” rather than billing hours. They felt busy because they were. They just weren’t busy with the right things. Monthly tracking caught this pattern early enough to fix it before it became a hiring problem, a pricing problem, and eventually a survival problem.
Here’s what annual reports can’t do: they can’t warn you. They’re like finding out you had the flu last February. Interesting, sure. Useful? Not so much. Monthly metrics are different. They catch trends when you can still steer. They show you the storm clouds before the rain hits.
The Five Monthly Metrics That Actually Matter
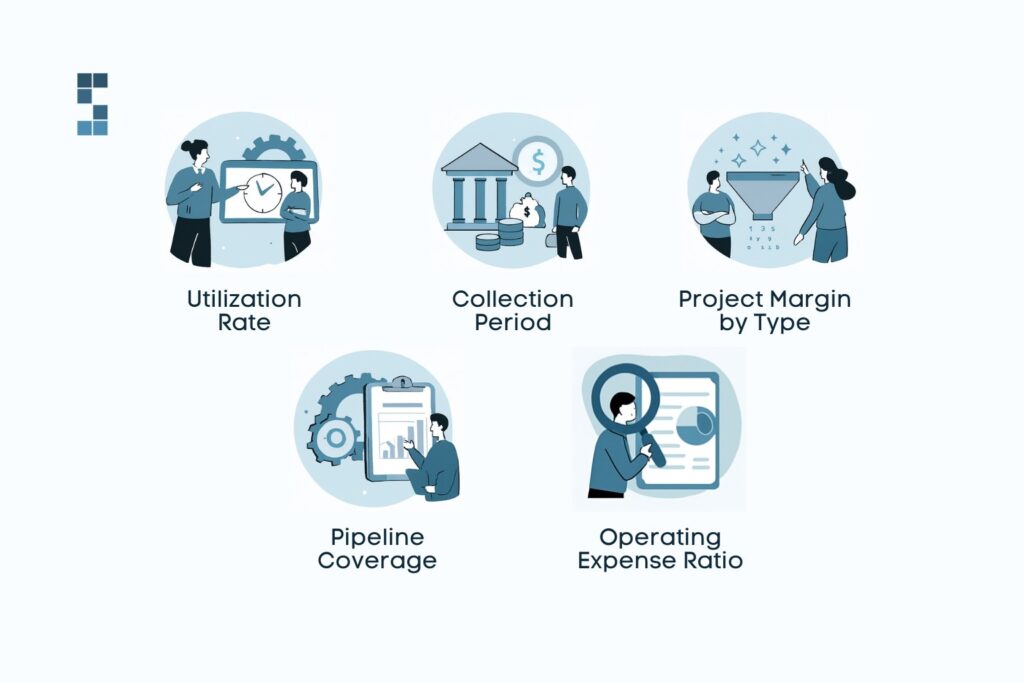
Not all metrics deserve your attention. Some are vanity numbers that make you feel good without telling you anything useful. Others are so granular they bury the signal in noise. These five hit the sweet spot—they’re simple to track, hard to game, and they tell you what you actually need to know.
Utilization Rate: Are You Actually Selling Your Inventory?
Your utilization rate is simple math: billable hours divided by available hours. But it’s anything but simple in what it reveals. For consulting firms, time is inventory. You can’t stockpile it. You can’t carry it forward. Every hour that passes without being billed is revenue that vanishes forever.
Good looks like 70-80% for most consulting firms. Higher than that, and you risk burnout and zero capacity for growth. Lower than that and you’re not converting your team’s availability into revenue. The real value shows up in the trend. When you slip from 75% to 65% over three months, you’ve got a problem forming. Maybe your pipeline’s thinning. Maybe your pricing’s off, and projects are taking longer than they should. Perhaps you’re overstaffed for current demand. The metric doesn’t tell you what’s wrong—it just tells you to look closer, right now, while you can still fix it.
Collection Period: The Silent Cash Flow Killer
This one’s measured in days from invoice to payment, and it creeps up on you like moss on a tree. Thirty days become 35, then 40, then 45. Before you notice, you’re essentially acting as your clients’ bank, financing their operations with your own cash flow.
The pattern’s predictable: clients push payment. You don’t want to be “that vendor” who nags about money. So you wait. They pay eventually. But “eventually” means you’re covering payroll, contractor payments, and operating expenses out of pocket while your clients hold onto their cash. One consulting firm owner partnered with System Six and watched their average collection period drop from 45 days to 22. “Our cash flow transformed overnight,” they said. Not because their clients suddenly became more ethical—but because automated reminders and better invoicing discipline changed the game.
Project Margin by Type: Not All Revenue Is Good Revenue
This metric takes your revenue and subtracts everything—direct costs, contractor fees, and crucially, that allocated overhead everyone forgets about. Partner time. Coordination calls. Proposal development. All of it. Then you break it down by service line or project type.
What you discover can be shocking. That showcase project you love talking about at networking events? The one with the impressive brand-name client? It might be breaking even once you factor in all the oversight time and scope creep. Meanwhile, those mid-sized projects you barely mention might be printing money. Jamie, an IT consultant, had this exact revelation: “We realized our technology implementation services were far more profitable than our strategic assessments. We reorganized our marketing to emphasize implementation and grew that service line by 40% within six months.”
The insight’s only available if you’re tracking project margins monthly. Annually, the patterns blur together. Monthly, they jump out at you in time to adjust your business development focus.
Pipeline Coverage: Today’s Prospects Are Next Quarter’s Payroll
Pipeline coverage asks a simple question: Do you have enough qualified opportunities to hit your revenue targets three months from now? The math’s straightforward—take your qualified pipeline, divide it by your monthly revenue target, and multiply by your close rate. You want 3x coverage because not everything closes.
This metric’s your early warning system for feast-and-famine cycles. When coverage drops below 2x, you know you need to invest in business development now, not later when panic sets in. When it climbs above 4x, you’ve got breathing room to focus on delivery and operations. One System Six client put it perfectly: “Instead of reactive hiring when we’re already drowning in work, we now can see three months ahead when we’ll need additional capacity in specific practice areas.”
Operating Expense Ratio: Are You Scaling or Just Getting Busier?
Divide your fixed costs by revenue. For most consulting firms, healthy looks like 40-60%. This metric tells you whether you’re scaling efficiently or just layering on overhead as fast as you’re adding revenue.
The ratio should decrease as you grow. That’s what scaling means—spreading fixed costs across more revenue. If your ratio’s climbing, you’re adding expensive overhead faster than you’re growing revenue. You’re building a more complex business without becoming more profitable. Monthly tracking catches this before it becomes structural.
From Spreadsheet Chaos to Dashboard Clarity
Here’s how it used to work: Saturday morning, pot of coffee, laptop open on the kitchen table. Pull data from your time tracking system. Export from QuickBooks. Wrestle it all into Excel. Build formulas. Cross-check numbers. Fix errors. By Sunday afternoon, you’d have an already outdated report and a weekend you’d never get back.
“Our financial reporting used to take 3-4 days each month,” a consulting firm owner shared after partnering with System Six. “Now it’s largely automated, providing real-time insights through dashboards we can check anytime.”
That’s the transformation. You stop compiling and start reviewing. Your time-tracking, project management, accounting system, and CRM all automatically feed into one dashboard. Monday morning, fifteen minutes, you know exactly where you stand. Utilization’s trending down? You see it. Collection period creeping up? There it is. Project margins shifting? Clear as day.
It’s like the difference between manually calculating your car’s fuel efficiency with pen and paper versus glancing at the dashboard. At the same time, you drive: the same information, but a completely different experience.
And here’s what nobody talks about: the psychological shift. “Good financial reporting didn’t just improve our profitability—it reduced our stress,” another consulting owner explained. “Instead of lying awake wondering if we’re making the right decisions, we now know where we stand and are headed.”
That’s worth more than the time savings. That’s worth more than the improved margins. That’s the difference between hoping your business is healthy and knowing it is.
Getting Started Without the Overwhelm
You don’t need to track everything on day one. Start with the two metrics that address your biggest worry right now, if you’re anxious about cash: track the collection period and pipeline coverage. If you’re worried about profitability, focus on project margins and utilization rate.
Master those for a month. Get comfortable with the rhythms, the patterns, what normal looks like for your firm. Then add complexity gradually. The goal isn’t a perfect measurement system—it’s a useful one.
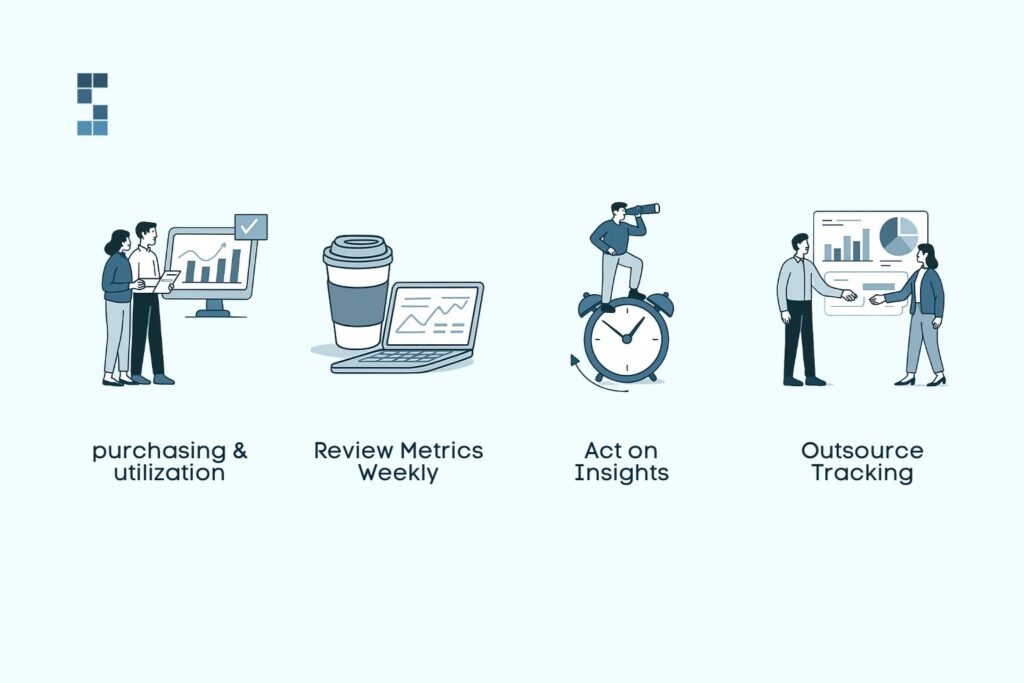
Set up automated data feeds so you’re reviewing insights, not hunting for numbers across five different systems. Make Monday morning your metric ritual. Fifteen minutes, coffee in hand, dashboard open. What’s trending up, what’s trending down, what needs attention this week?
These aren’t just numbers on a screen. They’re your early warning system. They’re your strategic compass. They’re the difference between reactive scrambling and confident decision-making. Many consulting firms outsource this entire setup and ongoing tracking because it’s faster, more reliable, and, frankly, more cost-effective. After all, they’d rather spend their time on client work than building financial dashboards.
Your Financial Pulse, Strong and Steady
You can’t manage what you don’t measure. But you also don’t need to measure everything. These five metrics—utilization rate, collection period, project margin, pipeline coverage, and operating expense ratio—give you the visibility to make confident decisions instead of hopeful guesses.
“System Six has done wonders for my stress level,” one client told us. That’s what clarity does. It turns 2 am anxiety into Monday morning confidence. It turns scattered data into strategic insight. It turns “I hope we’re okay” into “I know exactly where we stand.”
What would change in your consulting firm if you had complete clarity on these five metrics every Monday morning? What decisions would you make differently? What problems would you catch early? What opportunities would you spot before your competitors?
Maybe it’s worth exploring whether automated financial tracking could give you back your weekends and your peace of mind. Your firm’s already generating all this data. The question is whether you’re using it to get ahead—or just falling further behind.
About System Six
System Six is a Seattle-based bookkeeping and financial services firm specializing in consulting and professional service businesses. Our team of 40+ professionals brings an average of 10+ years of accounting experience to every client relationship, serving over 175 companies across the U.S. We operate on a fixed weekly fee model with no long-term contracts because we believe in earning your business through consistent value delivery. Learn more at www.systemsix.com.